6 November 2020
0 Comment


Oracle database has started to work proactively since 10G. Working proactively means taking measures by intervening as soon as we receive an alert about the database. As seen in the picture above, it does everything automatically.
Automatic Workload Repository (AWR): It is a storage area that keeps the statistical information necessary for the detection and solution of the problems, the performance statistics related to the database, and the information of active sessions. In other words, it works every 60 minutes by default and provides us a report by taking the workload of the database in the last hour, as a snapshot, thanks to the manageability monitor background process. Automatic Workload Repository is not available before 10g. We can analyze what is happening in the database by querying the AWR and analyzing the database. Server alerts will set certain upper limits for functions that will cause trouble for us, and give us alerts when there is an over-limit, and will allow us to intervene before a problem occurs. For example, by defining an upper limit for occupancy rates in our tablespaces, we can intervene when it approaches filling.
We said that the AWR will run every 60 minutes. This period can be changed. If we want, we can run it every 5 hours. However, AWR lists the top 10. So this is a disadvantage for us. Because the AWR received every 5 minutes and the AWR top 10 list received every 1 hour will not be one. In this case, it may mean that we may not see the report, which actually poses a problem for us. So the more often AWR runs, the more reports it will generate for us.
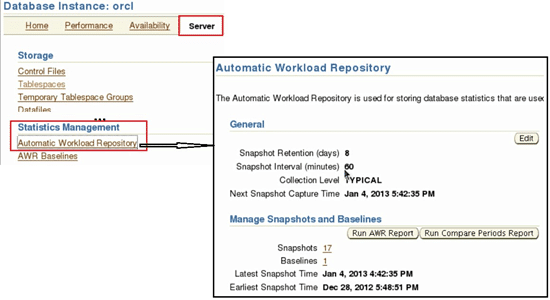
To view the AWR page, we go to the server tab and click the automatic workload repository link in the statistics management section. As seen above, the snapshot duration is 60 minutes and it keeps these snapshots for 8 days. It was 7 days before, but now it has been increased to 8. It is recommended to keep the 3-month period. The purpose of being 8 days is that it was made in order to compare the report received on Monday last week with the report received last Monday.
AWR reports are kept in the sysaux tablespace. We give reports a certain retention period so that they do not take up space in the Sysaux tablespace.
When we examine the picture, there is a red alert at the bottom saying that the db is down.
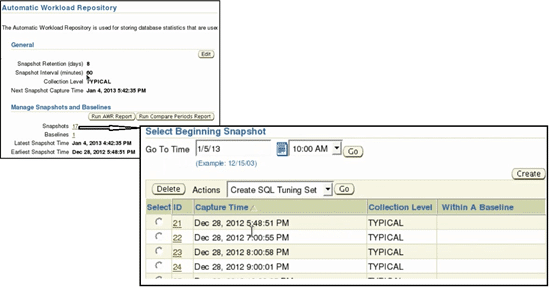
AWR Baseline (Snapshots)
Includes database statistics and metric metrics. We can also find application, operating system and other metrics in AWR Snapshots. Reports take snapshots every hour and we can compare between two captured snapshots if we want.
Statistics:
Even if a database is powerful as hardware, if statistics are not up to date, the power of the hardware will not work. Because when we draw the lines, it looks at the statistics and creates the execution plan and prefers the shortest and least costly path. Statistics are the structure that enables us to create these road maps. If we insert millions of rows right after the statistic is created, if we do not update the statistics, then our queries may take a lot of time or we may not reach the query. So statistics directly affect our System. The more up-to-date the statistics are, the better we work.
Threshold Values:
Lower limit upper limits, as I mentioned above, we can make assignments by saying that when we reach this limit, make an error like this when I reach this limit.
Oracle Optimizer:
It is called the structure that takes part in preparing execution plans for the written SQL statements. Optimizer makes use of statistics, other database objects that exist in the database, and uses the data information related to the table from the data dictionary views in the table. It does not produce the most efficient working method. Oracle optimizer does not produce the best performance, how it works optimally, and the structure that controls it in terms of both cost and performance is oracle optimizer. Let’s explain with an example
Let’s create a table now
SQL> create table emp as select * from hr.employees;
We created the name Emp, by copying all the data of the HR user in the employees table into it. And now let’s make a count query and see how many rows are in the emp table.
SQL> select count (*) from emp;
As a result, we saw 107 rows returned.
Now let’s run another query and this time let’s see the rows in the table with the table name. We’ll look at this via user_tables.
SQL>select table_name, num_rows from user_tables Where upper (table_name) = ‘EMP’;
Normally we should see that there are 107 lines, but the result will return to us as below.
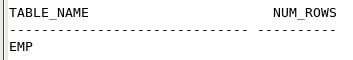
It looks as if there are no rows in the emp table, the data dictionary knows that this data has been created, but does not know how many records there are. As soon as we query any data related to this table, the oracle database has no chance to generate the correct execution plan for us. When we query data, the query result is returned, but if the number of rows were many, the result of the query could take a long time. The only reason for this is that the statistics are not up to date. Statistics are updated automatically. Updating statistics are linked to certain jobs. These jobs are updated every night at 10 o’clock. The statistics of all database objects whose statistics are not received are updated. However, this does not necessarily mean that we expect it to update automatically. Because the statistics of the transactions must be collected. Therefore, we can update it manually if we want. Let’s look at how to update the statistics. There are many methods of updating statistics. I will explain it on the example table we have created.
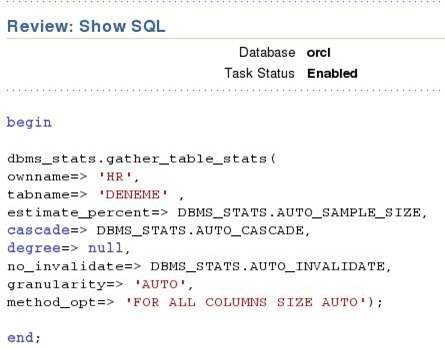
As for our command, the DBMS_Stats package is a package. On the PL / SQL side, there are ready-made packages created for the oracle database. We don’t need to do anything. DBMS_Stats is one of these packages. We have to execute this to get it working.
SQL> exec (paket_adı).(bu paket içindeki prosedürün adı) (‘şema adı’,’tablo_adı’);
Let’s apply to the table we have created according to the syntax above.
SQL> exec dbms_stats.gather_table_stats (‘HR’,’EMP’);
Now let’s run the query we just ran.
SQL>select table_name, num_rows from user_tables Where upper (table_name) = ‘EMP’;

Since the statistics seen above have been updated, we have seen that there are 107 lines at the end of our query. For this reason, it is necessary to keep the statistics up-to-date.
Another way to collect statistics is through enterprise manager. On the enterprise manager;
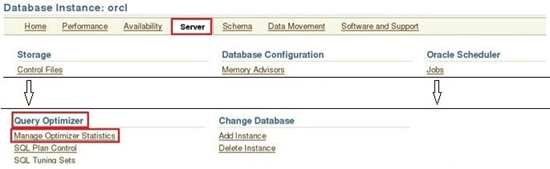
We come to the manage optimizer statistics page in the query optimizer section in the server tab.
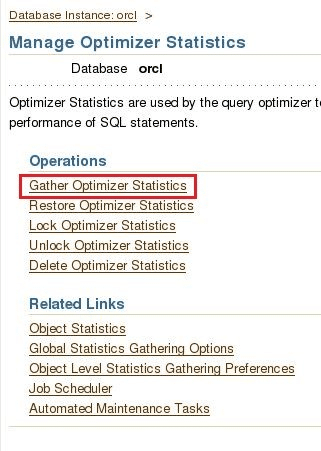
As you can see, we can do many statistical methods on this page. As we will collect statistics, we choose Gather optimizer statistics.
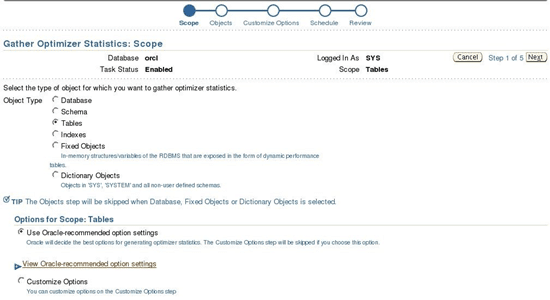
It asks for the object type in the page opened above. Here we understand that we can not only collect the statistics of a table, but also the statistics of a database, a schema, index or Fixed objects. However, the more data we want to access, the more databases workload, which increases the workload in getting statistics. Obtaining a complete database statistic is related to database size, transactions and queries, it is not recommended to get complete statistics of the database. However, getting statistics is a maximum of 4 hours. Since I will get the statistics of a table on the page above, I choose tables as object type and say next.
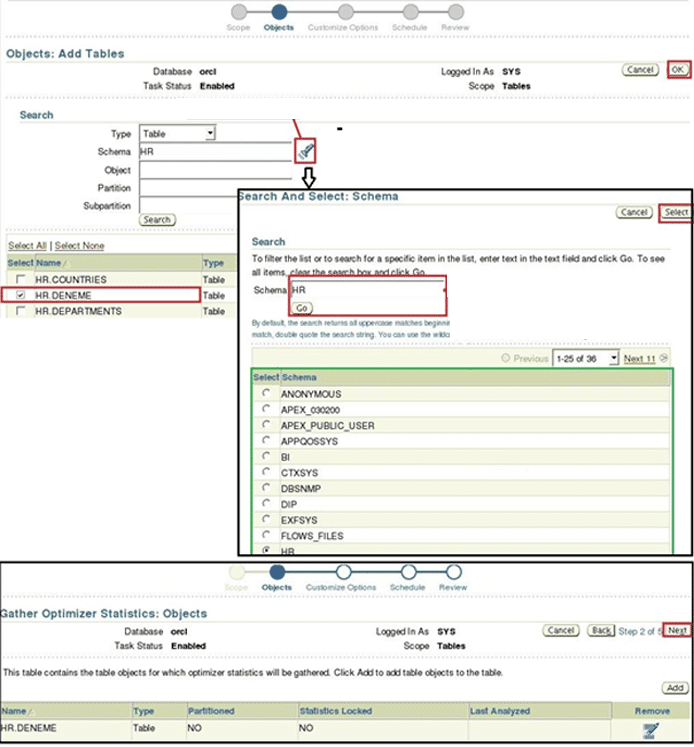
The Workload Source: Search and Select Schemas and Tables page appears.
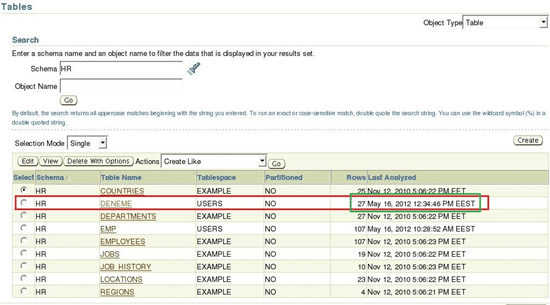
Now we can see that the last update date is current in the last analyzed column.
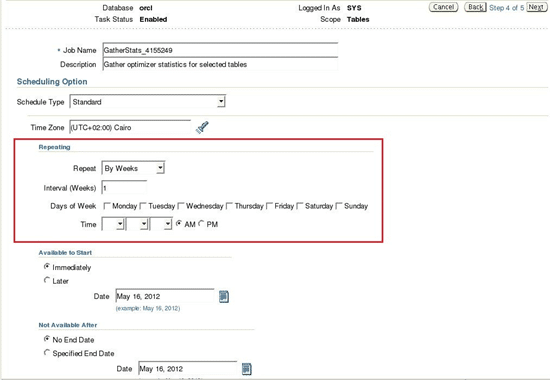
The next step is to decide on this type of work, the oracle database does this type of work with its default parameters. It is up to us to change and update these parameters. The ORACLE Database job, running at 10 o’clock, takes the statistics of the database objects that have no statistics, and also updates the statistics if the number of rows in the table exceeds 10%. However, this 10% part may be sufficient for some databases and may be more for some databases. Because if we assume that there is a table where insert, update and delete operations are performed very often, let’s assume that the number of rows in it is 30 million. To get the statistics of a table with 30 million rows, we would have to wait for 3 million rows to be entered. This is a huge number. We can give 2% change rate for specific tables. In other words, we can change this structure specific to the schema (schema) or database.
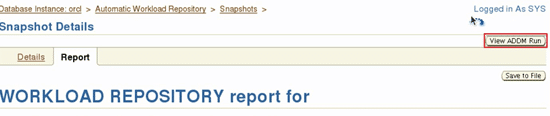
Let’s go back to the AWR. Detection of all problems in databases can be done here. If we get support from Oracle, they will request awr reports from us. Because in awr, we have all the performance information of the database, all the operating system information of the database, all the topsql information of the database, the information of all the memory value of the database. This report is very important for commenting on how the database works. While we need to know, while generating float reports, the managibility monitor (background process) looks at the statistics in the system every hour and takes a picture of the current situation and puts it in the awr. Awr reports are kept inside the SYSAUX tablespace. It is the place where reports are kept in the Sysaux tablespace enterprise manager. If there is already an enterprise manager, photos can be taken. Otherwise, it can be pulled manually. As we mentioned before, two enterprise manager users, varsdbsnmp and sysman, these reports are kept in the sysman scheme. If enterprise manager is not used, we will need to use dbms_workload_repository pl / sql package.
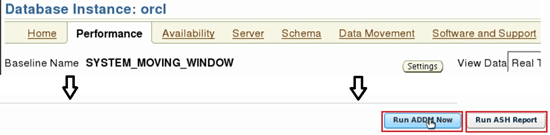
We can perform AWR related operations by visiting the automatic workload repository page under the statistics maagement section in the server tab on Enterprise Manager. With Run AWR Report, it can generate an AWR report immediately. If we want, we can set it to receive AWR reports by the hourly or by the edit button.
Statistic Levels:
Basic: AWR statistics are not kept at basic level.
Typical: Typical level only keeps statistics of the important ones.
All: statistics of the entire database is kept.
Automatic Database Diagnostic Monitor (ADDM):
It works after every snapshot. It monitors instance and enables us to detect many important problems in advance. And it provides us with solutions to problems. It is up to us to apply it or not. For example;
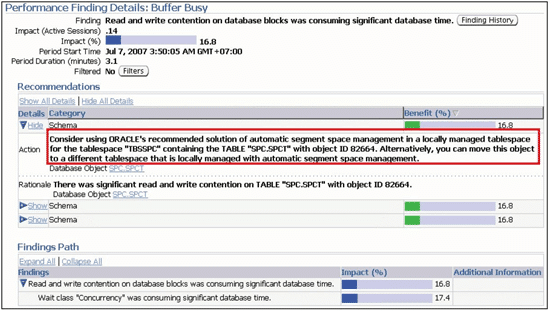
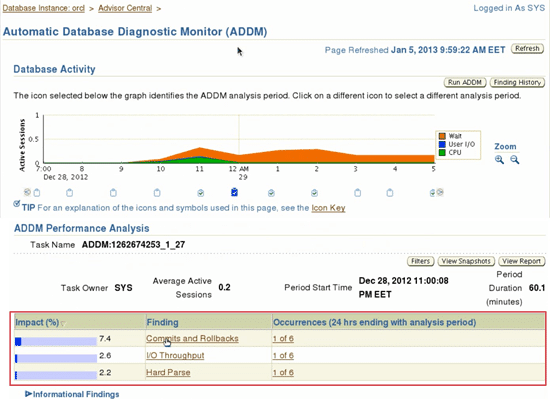
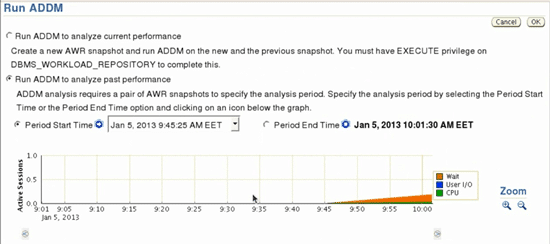
On the Run ADDM page, if we want, we can determine the time interval and provide recommendations. For this, by selecting run ADDM to analyze past performance, period start time is selected, and the photo maker that appears for the start time is selected from the timeline. Then select period end times and again select the end time from the timeline and press the arrow button, so it will generate recommendations for us.
ADDM shows its recommendations under the diagnostic summary on the homepage. In addition, such jobs will automatically run at 10 am. Let’s mix AWR runs every hour by default.
If you do not use enterprise manager or do not have an 11G database, you need to know DBMS_PACKAGE well for this topic.
If we want to call Advisor packages from the command line or in a 3rd party tool like toad, we can use the DBMS_ADVISOR package. This package can be used for all advisors too. The procedures for this package are given in the table below.
Automatic Maintenance Tasks:
There are automatically prepared tasks that are automatically run by the database instance.
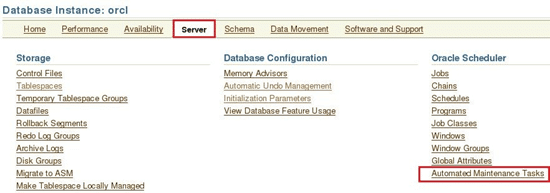
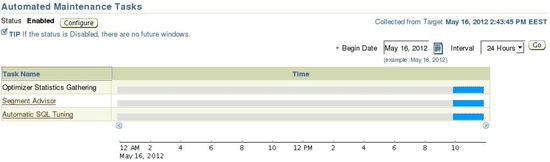
We are seeing the structured tasks. These tasks are automatically running at 10 o’clock at night.
Optimizer statistic Gathehing:
It is the task that will update the statistics in the database.
Segment Advisor:
This task is related to the existing segments of our tablespaces. It scans all files (files). It checks and tells us that there are these objects in the tablespace, it is closing too much space, and that we need to save space immediately. It performs such operations.
Automatic SQL Tuning:
It rearranges the SQL statements we have written. Evaluates the performance of SQL statements and tells us the best expressions.
These are the jobs that work every day. We can make adjustments on these jobs. For example, these jobs do not need to work on Sunday because we can say that there is no action on the database on Sunday, then we can configure it.
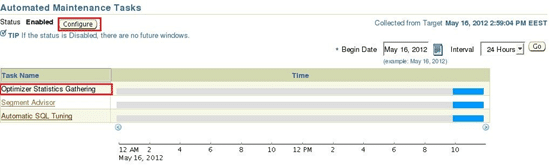
When we click on the file we want to configure and press the configure button on the top left, a page like the one below will open.
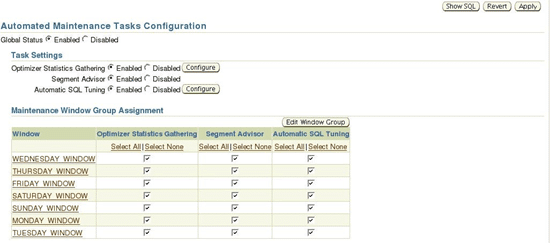
On the page above, we can readjust which flood will run on which days if we want. Or if we want which flood cannot be run, we can disable it in the task settings above. And if we want, we can change the configurations by clicking the configure button from the task setting again.
We talked about thresholds in the subject, that is, the upper limit is the lower limit. If the action comes to this value, it means to give a warning warning, if it exceeds the value of warning, it means to give a critical warning. Now there is a section called related links under each tab to access them.
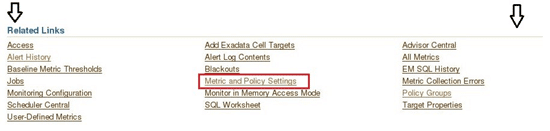
There is a link in the Related links to set the thresholds values. Matric and policy settings will open the following page when we click this link.
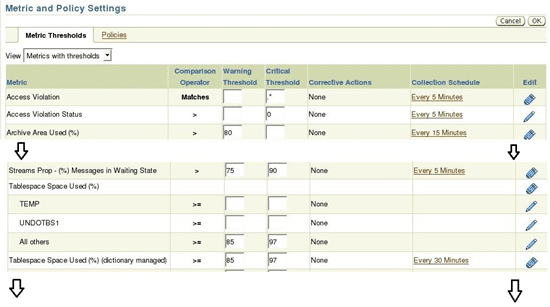
We can change the thresholds value that we deem necessary from this page. For example, on the tablespaces page for tablespaces, we edit the tablespace where we want to change this thresholds value and one of the tabs on the incoming page has the thresholds tab. We can set it up here too.
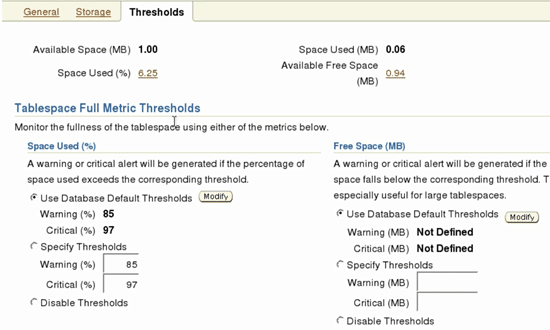
Let’s say edit to any tablespace in the tablespace link in the server tab. And let’s switch to the thresholds tab on the page that opens, for this tablespace, the thresholds is default, but if we want, we can set the warning and critical values by selecting the thresholds.
All resolved or unresolved alerts are kept in dba_alert_history.
Great, Have a nice day.

Tags: